The Graph of Con-nection
Leveraging Graph Theory in Game Design
Train games are a perennially popular game genre. There are entire conventions devoted to train games.
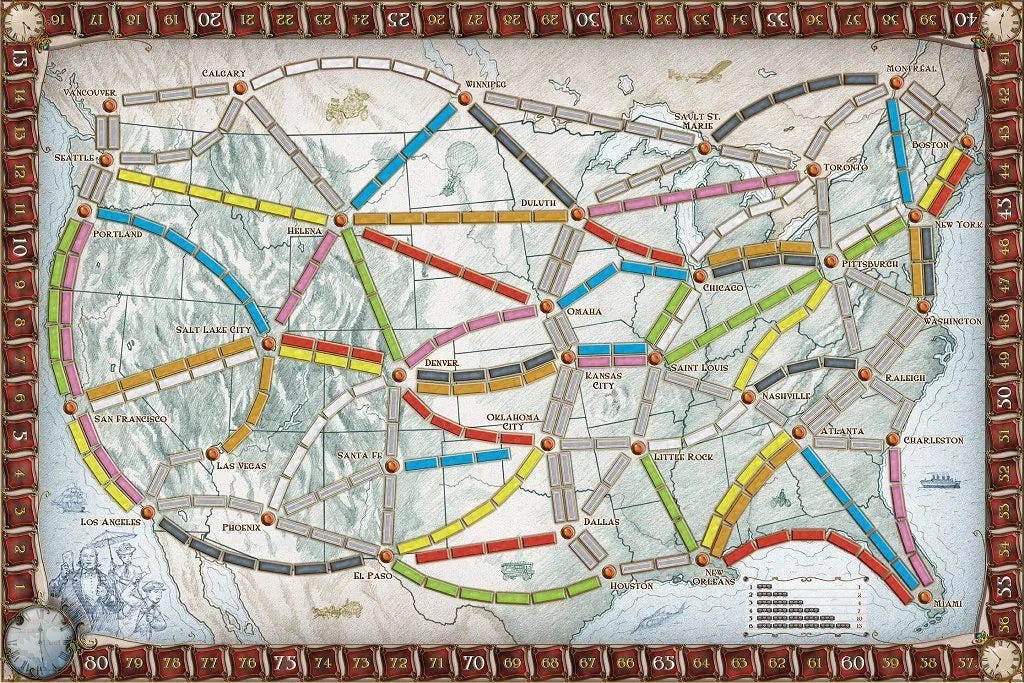
There are a lot of different types of train games – pick up and deliver, stock manipulation, technology improvement – but almost all involve connecting different places on a map and the construction of a rail network. This has a direct allegory in the area of mathematics called Graph Theory. Graph Theory is the study of networks. A network is a series of nodes connected by paths. Picture dots connected by lines. In math parlance they are called vertices and edges.
On a Ticket To Ride board the cities are the vertices, and the tracks are the edges.
Graph theory got its start in 1736 in a paper written by one of the great mathematicians of all time – Leonard Euler of Switzerland. Euler tackled the famous Seven Bridges of Königsberg problem.
Königsberg was a city in Prussia on the Pregel River. There were two large islands in the middle of the city that were connected to the city and each other by seven bridges. The problem was to try to find a path that went over every bridge, but each bridge being crossed only one time.
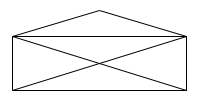
Euler was able to demonstrate that it was impossible to do. He proved that the problem was equivalent to a map of nodes and lines, and that you could only trace a complete path through such a graph if there were no more than two nodes with an odd number of connections. This is equivalent to the children’s puzzles where you have to trace a figure without lifting your pencil off the paper, and not going over the same line twice.

Fun Fact! Any shape with no more than two nodes with an odd number of connections can be drawn without lifting your pencil from the paper.
Graph theory has gone in a thousand different directions over the subsequent 270 years, and is used to study the internet, social networks, and disease propagation, among other topics. But today I’d like to talk about – hold onto your hats – Erdős–Rényi random graphs, and how they relate to train games, especially games like Trans-America.
Here’s how you make an Erdős–Rényi random graph. Take a blank piece of paper and put a bunch of dots on it. Now randomly pick two dots and connect them with a line. Then do it again – pick two random dots and connect them with a line. Keep doing this over and over again until all of the dots are connected into a single blob.
Now here’s the interesting part. After connecting each pair of dots, find the largest group of dots that are connected and record how many dots are in that group.
What you’ll find is that the size of the largest group starts out small and stays small for quite some time. In fact, if the number of connections is slightly less than half the number of dots the largest group will be pretty small.

But once the number of connections is slightly larger than half the number of dots, their arises a single, dominant, large group of dots that will eventually absorb all of the dots in the graph.

The curve showing the largest group of dots has an S-shape, with the steep rise right when you reach the halfway point.

In science this is called a Phase Transition – a sudden change of a system from one state to another. Just as water changes from a liquid to solid ice quite suddenly, so too does the graph change from a ‘liquid’ state – where there are lots of small groups – to a ‘solid’ state – where there is one giant clump of dots.
I personally find it amazing – and pretty cool – that a simple system like this – dots and lines – can exhibit such interesting and unexpected behavior.
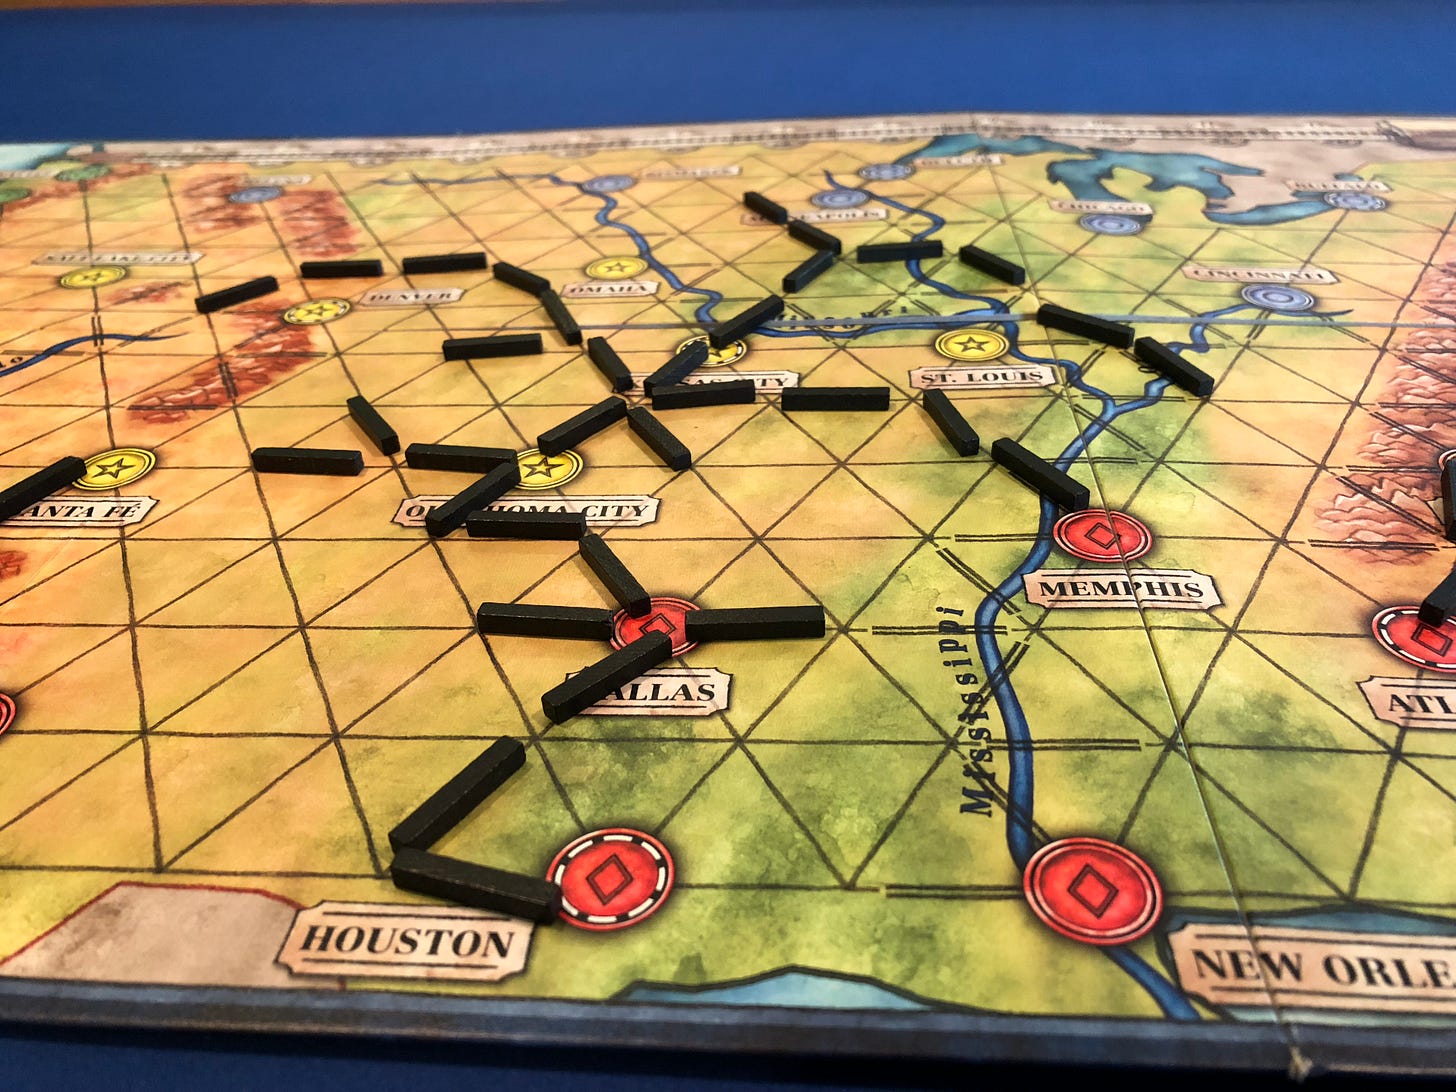
You will see similar behavior in many train games, where cities are connected by paths. In Transamerica, for example, the players place tracks onto a map of the United States trying to connect their five secret destination cities into one network. But all the players share the same track, so you want to try to take advantage of where your opponents place tracks.
Transamerica is, admittedly, a very light game. But it does have this interesting property of a phase transition. At first players work on independent segments of tracks. But then eventually you have to make the decision of when to merge the tracks together. And it seems to happen all at the same time, as players make a last effort to reach their targets. There is indeed a phase-transition in the nature of the connecting track about halfway through the game. The tracks change from a ‘liquid’, separate, state, to a big clump of tracks.
And, I would argue, this feature is precisely what makes Transamerica such a neat game.
A similar thing can be seen in the crayon rail games like Empire Builder. At the very beginning you are struggling to find routes that you can build, and you try to be opportunistic and take what you can. But then, usually too late for me unfortunately, you reach a point where there are a huge number of possible deliveries you can make. Your network becomes super-connected, and rather than struggling to find a single run, you are making tough choices about which runs to skip. And that change usually happens very suddenly, much like a phase transition.
So the next time you are playing a connection game, whether it’s a train game, or some other theme like the hotels of Acquire, think about graph theory, and the phase transition between small groups and a super-connected network. It will give you a new appreciation for the phases of the game, and new insight into how to predict what’s going to happen.
You can also use this technique when designing a game with connections. The most interesting time is when about half the map is connected. Try to tune the end of the game, or critical moments, to hit at around that time. Your players will appreciate the climactic moments this creates.
Plus, you’ll get to say to your friends “This game is just like Erdős–Rényi random graph theory!”


Love it. Thanks!
Yes, this is a really interesting area.
I tried to make a game concept based off this sort of thing after reading an article in 2021 about Hong Kong protesters use of local connections to form peer-to-peer messaging networks and how there is a threshold/phase transition of average number of connections where complete coverage is guaranteed (like in your S curve image).
In a similar way you can tune number and colors and connections when designing tiles or cards which are intended to be built into a grid - where once all laid out they are guaranteed to al be connected - or are likely to make bigger groups. If you overlay different color's of connections though on each node, and so generate multiple linked overlaid networks with different values of average connection it gets more interesting - But I'm still not sure how it makes a good game yet :)