
EMERGENCY GAMETEK POST
New Study Just Dropped

I wasn’t planning on posting a new GameTek this week (it’s my birthday weekend!) but I couldn’t resist sharing this data.
A new poll from YouGov was just released, surveying what Americans pick in various ‘chance’ situations.
These charts break down some of the data, and they are GameTek-Catnip. Hence the EMERGENCY POSTING. They are taken from the article How To Win At Games of Chance.
When calling a coin flip are you more likely to call heads or tails?
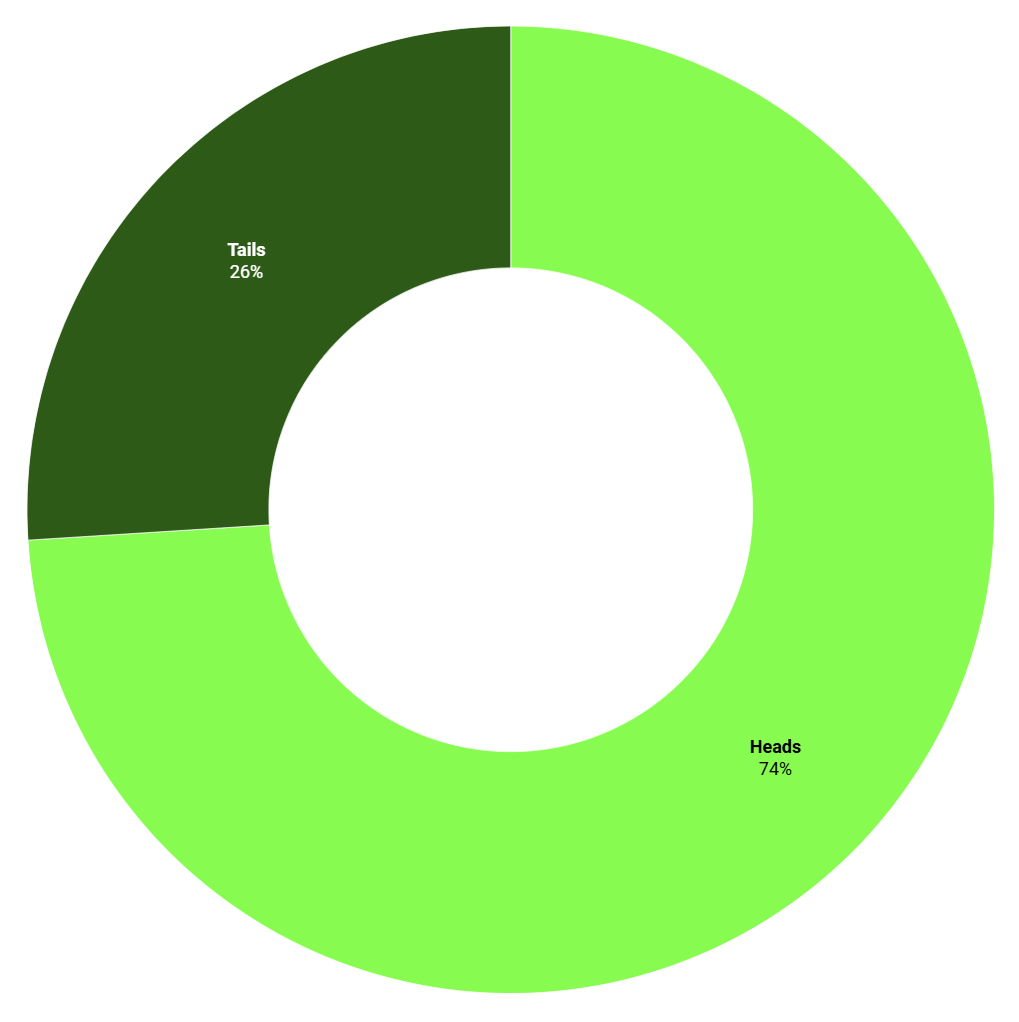
Why is heads so much more popular? I don’t know. Maybe there’s a clue in the cross-tabs:
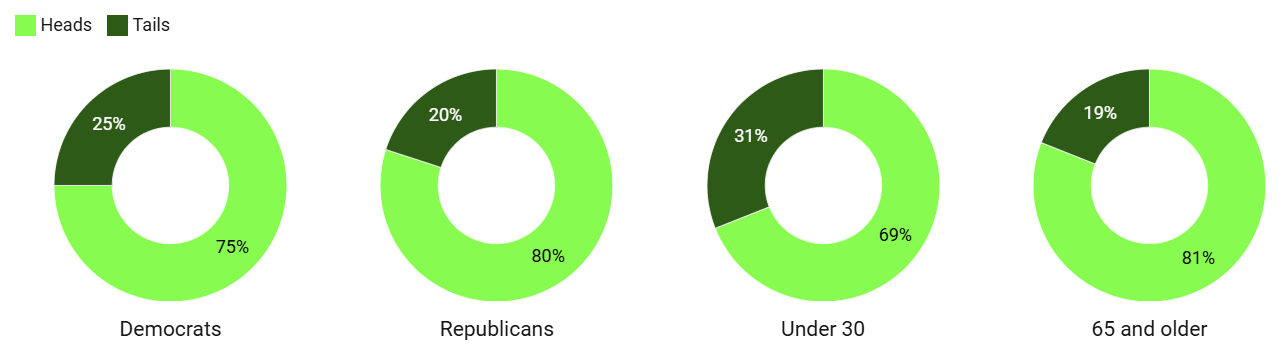
Heads is the most popular across different demographics. However, one thing seems clear - we are more likely to pick heads as we get older.
If you subscribe to the theory that we get more conservative and ‘safer’ with our choices, I guess you could posit that ‘tails’ is the choice for rebels.
Rock, Paper, or Scissors?
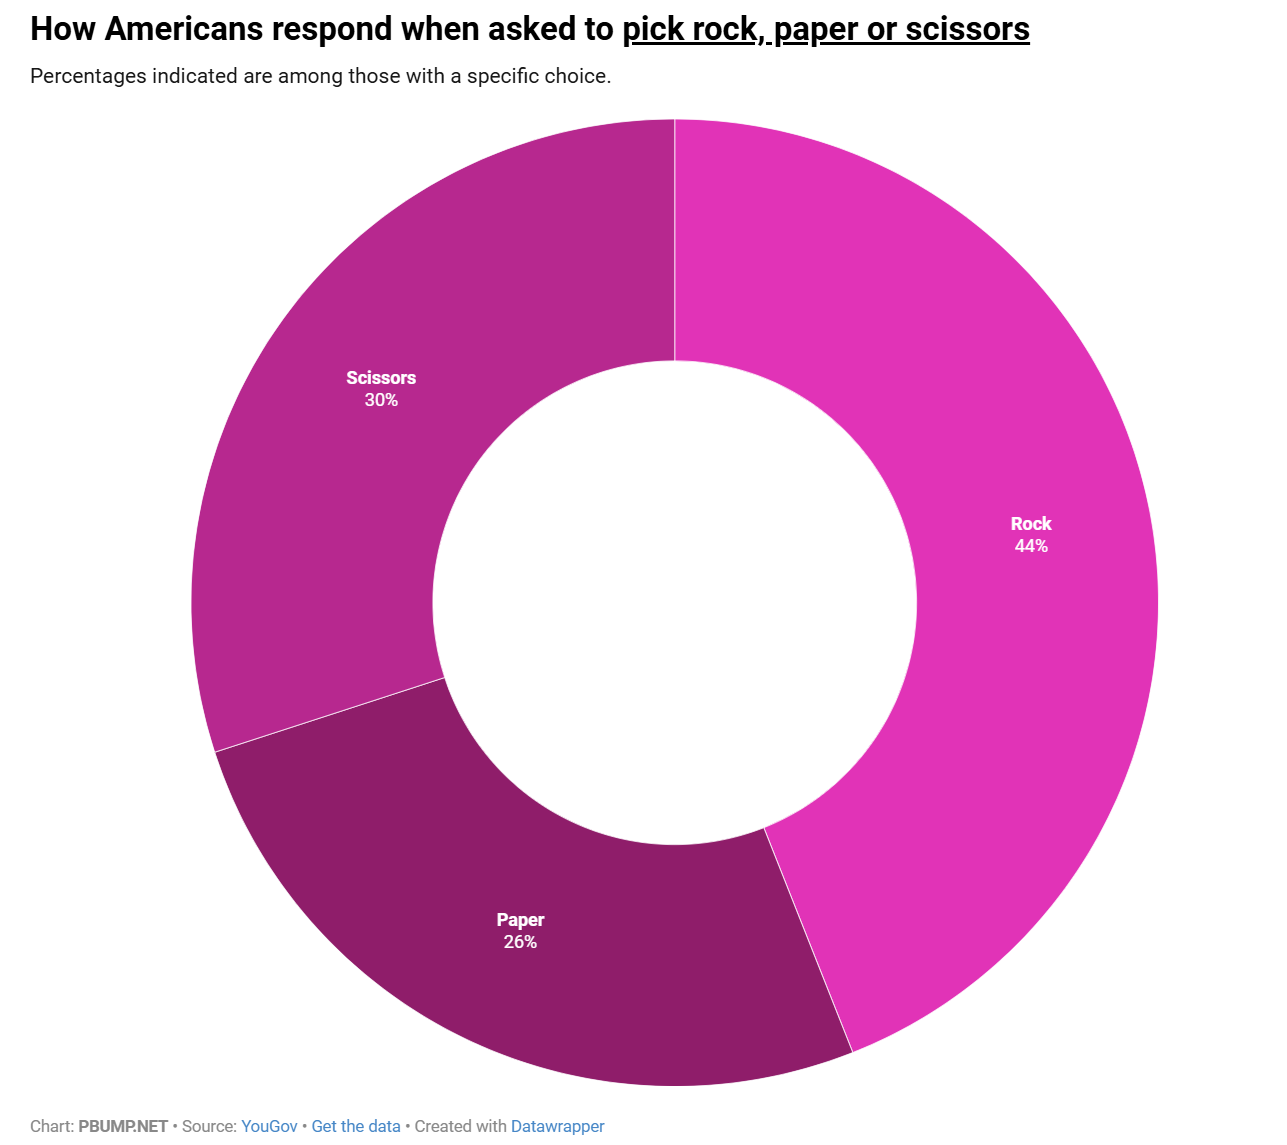
70% more people choose Rock than Paper. Rock is clearly the ‘safe’ choice, comparable to ‘heads’ in the coin flip scenario.
Once again The Simpsons was right on target.

Here’s the demographic breakdown on RPS:
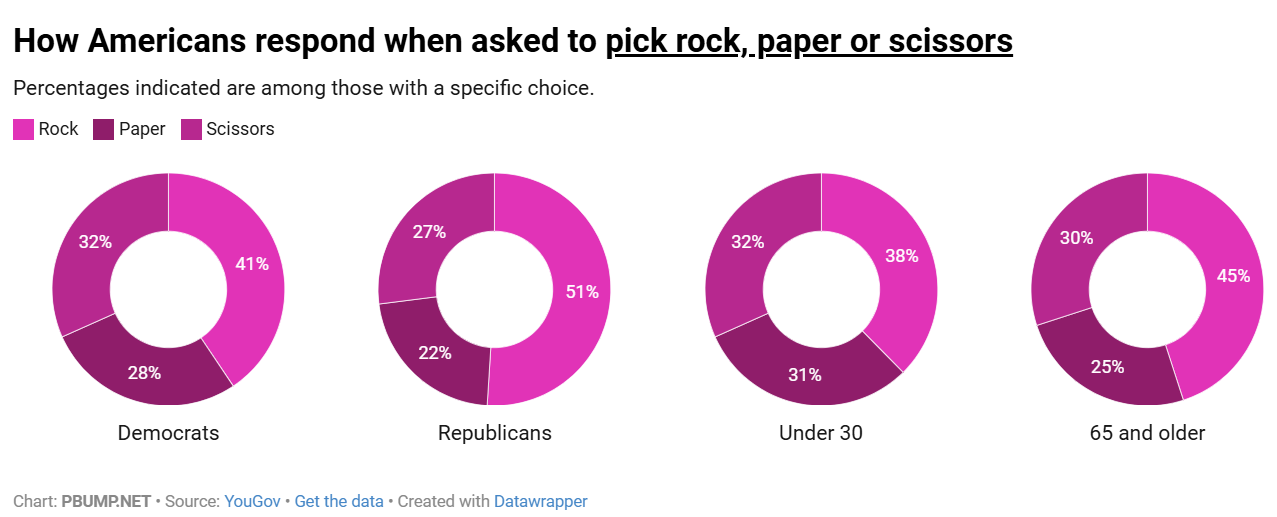
All categories pick Rock most often, but the age difference we saw in the coin flip carries on here. As you age you tend to pick Rock more often.
And if you’re playing Rock-Paper-Scissors with a Republican, you now know what to do.
One final scenario:
Pick a number from 1-10
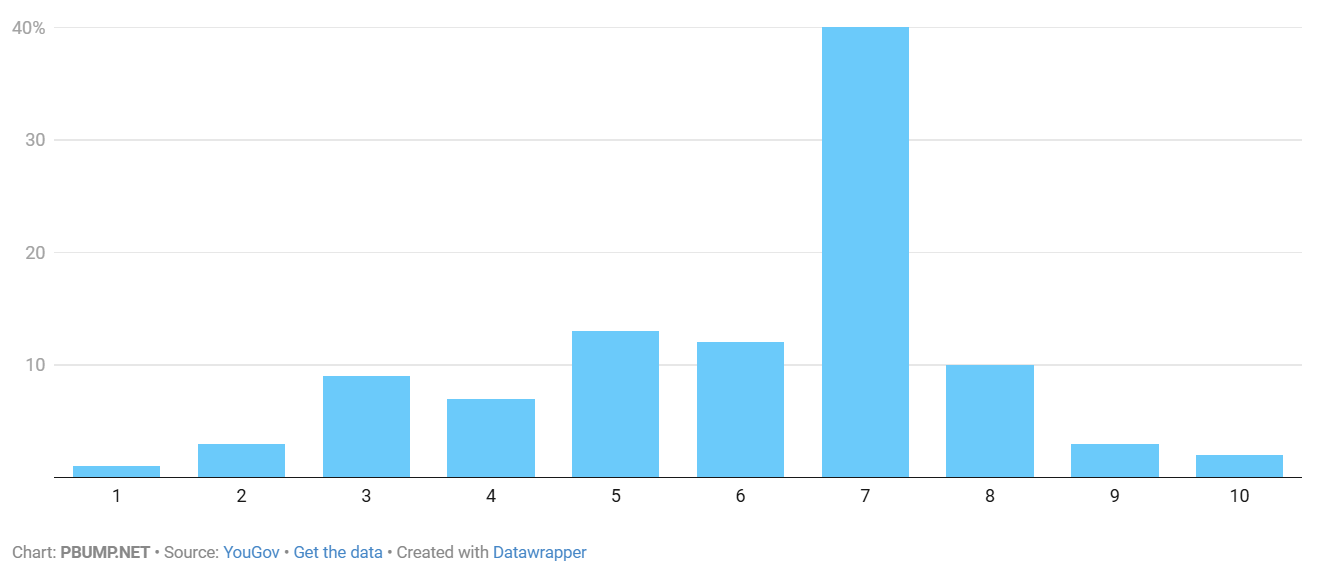
Almost 40% pick 7! Lucky number 7 indeed.
We are all really bad at picking a random number, and also at deciding whether a sequence we are looking at is random. We tend to think that odd numbers are more ‘random’. It seems intuitive that people would think and that 1, 3, 5, and 9 seem more ‘normal’ than ‘7’. The 7’s multiplication table is almost certainly the hardest to memorize.
Given this question I would have predicted that 7 would be the most popular choice. But 40%? That’s mind boggling.
Here are the breakdowns:
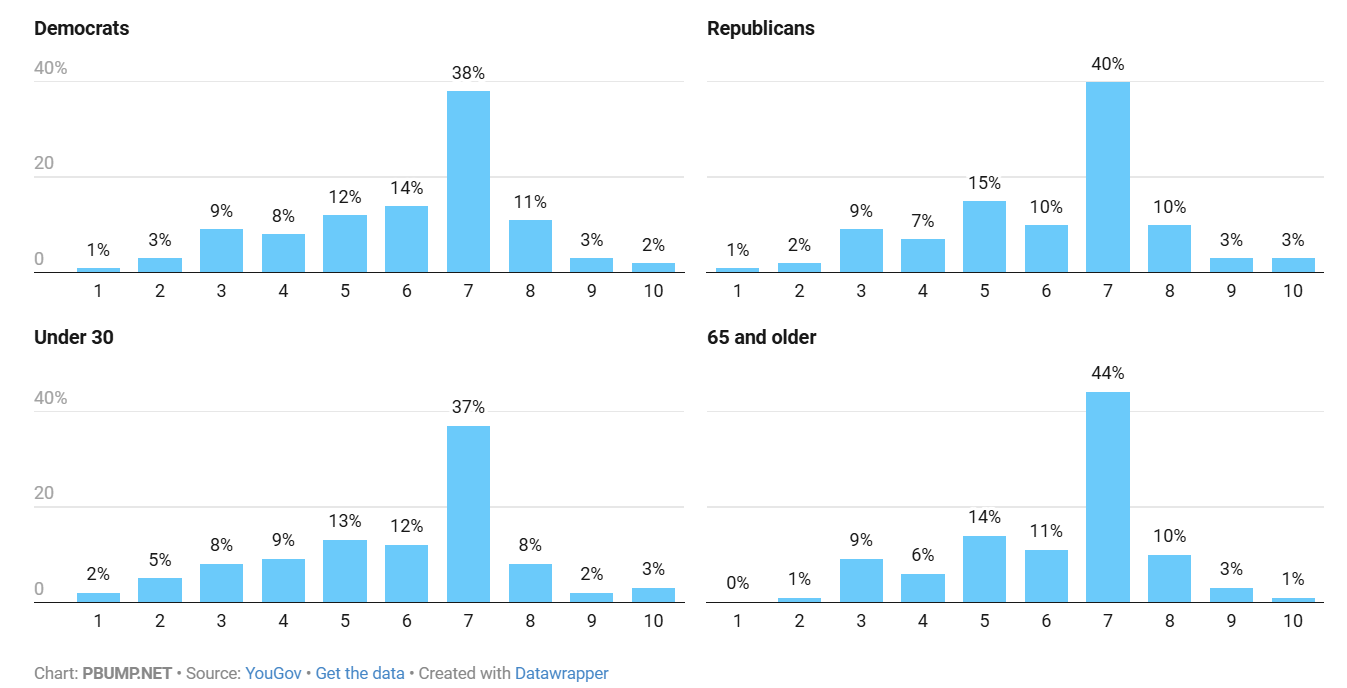
There are several interesting points to highlight here:
Again, older people are more likely to move towards the ‘mode’ - the most popular choice. You see this with 7 moving from 37% to 44%. But you also see it dramatically at the extremes. 2% of under-30’s picked ‘1’, but '0%’ of those 65+. I actually checked the underlying raw data, and zero people out of 88 surveyed age 65+ picked 1.
Similarly 3% of under-30s picked 10, but only 1% of 65+.
So as we get older we move away from the ‘rebel’ choices and more into the ‘normal’ picks.
What do you think about this data? How would you use this to inform your design choices? Post your comments!
Happy Birthday! My theory: because "heads" is always mentioned first ("Call it in the air, heads or tails," it is psychologically the more obvious choice. And "Rock" is chosen more because it's the easiest: you make no change to your hand, since both hands start out as a fist. So again, the fist "rock" is psychologically the most obvious (or safe) choice. What about "7"? Well, 7 has a long history as a very meaningful number in multiple cultures, so again, it's exposure to us in so many different areas of life could make it the first number that comes to mind. It's like my 19-year-old son who still remembers television jingles from his 7th-grade year in the U.S. If we hear something enough (or always first), we will subconsciously lean toward that answer as the most obious or safe one.
Is it possible that 1 and 10 are picked less because of how people interpret "between 1 and 10"?