Markov Chains for the Game Designer
I was recently trying out Atlantic Chase from GMT, and noticed an interesting feature about the weather system. There are only two states for the weather - good or bad - and each turn you roll to see if it changes. Here's an image of the chart taken from the rules (which is why it's weirdly tilted):
If the weather is good, it becomes bad on a 6. If it's bad, it changes back to good on a 5 or a 6.
This is a simple example - perhaps the simplest example - of what is called a Markov Chain. Understanding them can be a useful tool for a game designer.
Markov Unchained
A Markov Chain can best be understood as a State Diagram. A State Diagram is sort of like a flow chart. The system is in a particular 'state', like Good Weather or Bad Weather in Atlantic Chase. Then there are ways the system can move between states.
It is best visualized as a diagram. Here's the state diagram for Atlantic Chase weather:
Each state is represented by a box - Good Weather or Bad Weather in this example. The arrows show the transitions between the two states. If you are in the Good Weather state there is a 1/6 chance of going to Bad Weather, and 5/6 of staying in Good. If you are in Bad Weather there is a 2/6 chance of changing, and 4/6 chance of staying in Bad.
A key characteristic of Markov Chains is that they can't have any history or memory. How the state changes is dependent only on the current state and current inputs. If, for example, if in Atlantic Chase you got a +1 modifier to the Weather die each time the weather stayed the same, that would no longer be a Markov Chain.
(side note: It would actually be possible to turn that into a Markov Chain by adding more states - Good Weather with +1, Good Weather with +2, Good Weather with +3, etc, each with their own transitions. But you get the general idea)
One of the key things we want to know from a Markov chain is how much time it spends in each state. In our weather example, what percentage of the time will have Good Weather, and what percentage Bad Weather?
With just two states this is very easy to solve - and your intuition is probably correct. 2/3 of the time the system will be in Good Weather, and 1/3 in Bad.
Of course, this is over the long term. If you start in Good Weather, you may not move to Bad Weather at all in a short game. But if are many, many turns you will have a 2:1 Good-to-Bad ratio.
Here's another example of a Markov Chain in a game - the original version of Evo (Keyaerts, 2001). A key part of Evo is the climate.
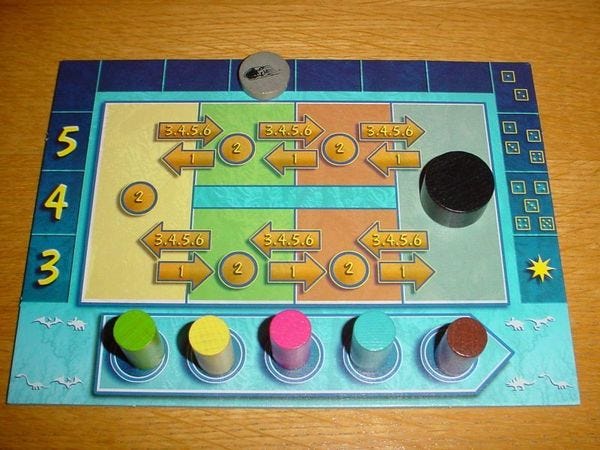
Below is the Evo Climate Chart. The current Climate is marked by the black disc.
Each Climate step a die is rolled, and the disc is moved back a space on a 1 or forward on a 3-6. On a 2 it stays the same. Because of the symmetry of the board it is easy to see that the climate will spend equal amounts of time in each space - on average. In individual games it may vary from that behavior of course. And you can tell that on average it will move forward 1/2 space each turn:
(1/6 x -1) + (4/6 x +1) = 1/2
Relating to that, sometimes you may want to learn the short-term behavior of a Markov Chain. If I start in Bad Weather, what does that look like on average over, say, 10 turns?
Unfortunately, it's tough to solve for that analytically. However, if you are code-savvy it is pretty simple to implement a State-Pattern and do a Monte-Carlo simulation where you step through a certain number of turns and track what the state is at each step.
That's beyond the scope of this article though, so let's get back to the long-term trend of a Markov chain with a more complex example.
McMulti
The 1974 McMulti (also published as Crude), designed by James St Laurent, has a number of fascinating aspects. Many inspired later designs, such as random production rolls shared by all players, a design motif later adopted by Catan.
However I'd like to focus in on the economy system. There is an overall 'Global Economy' state that impacts a lot of features of the game. Specifically there are seven possible economic states:
Rapid Growth
Prosperity
Downturn
Recession
Depression
Recovery
Expansion
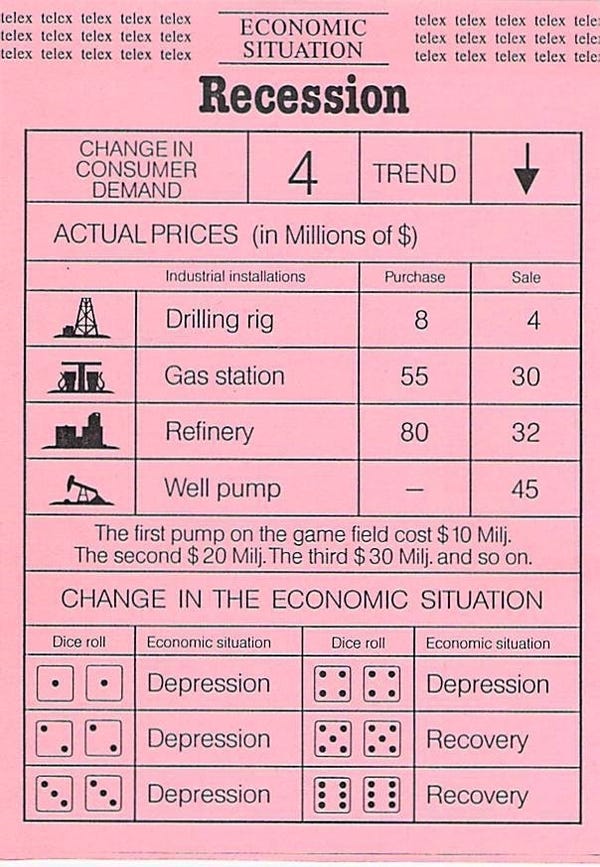
Each of these comes with a card, which is displayed when it is active. Here are two samples:
(Fun fact! I scanned these cards from my copy of McMulti, which I got from the estate auction of legendary game designer Sid Sackson!)
At the bottom of each card you'll see a change chart. The economy changes on doubles, and the new economy is chosen based on which of the six doubles are rolled. For example, in Recession, if 3-3 is rolled, the economy changes to Depression.
As you can see from these two cards, the movement is NOT symmetric in McMulti. Recession always moves to either Depression or Recovery. Expansion can actually stay in Expansion.
Your intrepid newsletter writer went ahead and constructed the full state diagram for McMulti:
To keep the diagram simple, the number on each transition is the total number of dice combinations that lead to that state. For example, there are two lines coming out of "Depression" - one with 4 and one with 2. That means that there's a 4/6 (2/3) chance that you move from Depression to Recovery, and a 2/6 (1/3) chance you move to Expansion.
There are a few interesting features of this graph. First, in general you will move clockwise around the circle. The most likely transition (4 in most cases) goes to the next state.
However, there are definitely some areas where weird stuff is happening. Recession and Depression never go 'backwards' for example (counterclockwise). They always move ahead. And Expansion is the only state that can return to itself.
I have not spoken with Mr. St. Laurent, so I don't know for sure. But I have to believe these asymmetries were added for a reason, perhaps to reflect his research or opinions on economic cycles, or perhaps for a gameplay reason.
Regardless, it's a pretty complex web.
So as a designer, if you develop this type of system, how can you tell the behavior? Will your game spend equal time in all states? Or will it tend to linger in some longer than others? If so, how much longer, and is that what you really want?
Before we dive into how to solve this problem, spend some time looking at the graph. Try to figure out, just intuitively, what you think will happen. Where will the system spend the most time? How much more?
Into the Matrix
We're going to figure out the answers to those questions using techniques from a branch of mathematics called Linear Algebra. It's actually astonishingly useful in a wide variety of situations. Unfortunately for me, my Linear Algebra class in college met at 8 AM, so it's all a little hazy.
However, I remember enough to get by.
I'm going to show how to solve problems similar to this using Excel. If you'd like, you can download a copy of this workbook and follow along.
The first thing we'll do is construct a matrix that shows the probability transitions. Here I've converted the diagram to a matrix:
This is called a transition matrix. It's actually pretty easy to construct once you have the state diagram. Each column shows the probability of transitioning to the other states. It also encodes our state diagram in seven dimensions, which is pretty cool. Hence the name of this article, way back at the top.
The first column is Rapid Growth. If you look down, you'll see there's a '4' next to Prosperity, a 1 next to Downturn, and a 1 next to Expansion. If you look back at our state diagram you will see that those correspond to the three arrows that come out of the box.
There is no chance of moving from Rapid Growth to any of the other states, so there are zeroes everywhere else.
Each column encodes a state in the same way.
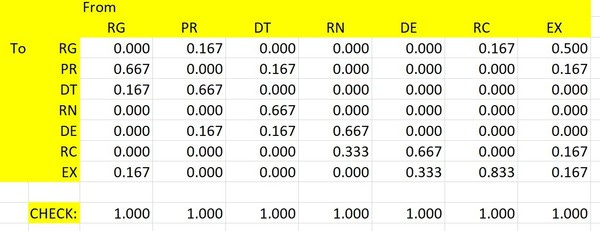
Of course, the probability isn't really '4'. It's '4/6', so we need to make another matrix that divides every number by 6, and we get this:
This is caused a 'normalized' matrix. Each column must add to '1', since there's always a 100% probability of something happening. Make sure to add the 'self' transitions - you'll notice that at the intersection of EX and EX there's a 0.167. This is because there's a 1/6 chance of staying in the EX state. No other state does that, so the main diagonal (where the same states meet) is zero everywhere else.
When I do this I like to add this check row at the bottom just to make sure I didn't mess anything up. It should be 1, as it is here.
OK! So this matrix completely describes our state diagram. From this matrix anyone could reconstruct the original diagram - they are isomorphic: they describe the same thing in different ways.
The next step is to figure out how these transitions actually behave.
What we're going to do is say that we have 100 'turns' from each state, and we want to see where they go. For example, if we put 100 turns into Rapid Growth, 2/3 will move to Prosperity, 1/6 to Downturn, and 1/6 to Expansion. (I'm going to call these 'points' instead of 'turns' from now on. But basically, think of it as loading up each state with a bunch of stuff, and then it flows out of each transition based on its size).
I'm going to create a state vector with 100 in each state. Here's my matrix with the state vector next to it.
The state vector is circled in red. It's just a '100' on each row. I've put a zero above it to show that this is our start - 100 points in each state.
By the way, for those that don't recall, a 'vector' is just a fancy term for a one-dimension list of numbers (a row or column). A 'matrix' is a fancy term for a two-dimensional array of numbers - a table, in other words.
So what we want to see is how all 700 points move around our state diagram if we do one step. Everything is going to flow around.
You could do this by hand of course, but linear algebra has shown us an easier way - Matrix Multiplication. If we multiply the matrix by the vector, the answer comes out automatically. And fortunately Excel has a built in matrix multiplication function: MMULT.
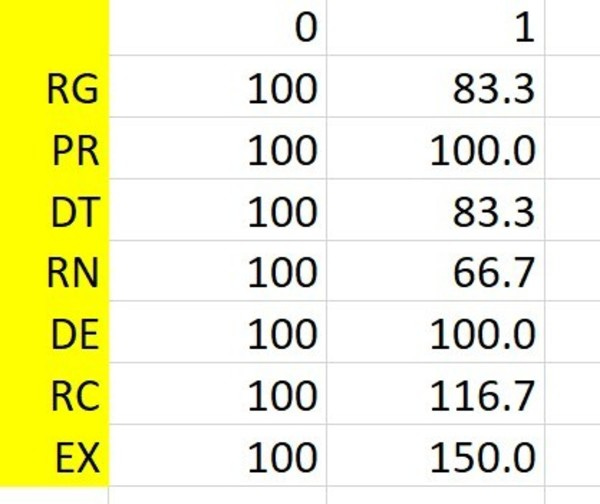
If you multiply a matrix by a vector you get a new vector. And in this case the vector represents where our 'points' end up in the state diagram.
There's the result. We end up with 83.3 points in Rapid Growth, and a whopping 150 in Expansion.
That actually makes a lot of sense, because there's a lot of arrows that go into Expansion, and not many that go out. Of course, now that there's a lot in Expansion, the next time we run the state machine there will be more to flow out.
To do the next time step we simply do another Matrix Multiplication, but this time multiplying the matrix by column '1' instead of column '0'.
Pretty interesting! Rapid Growth has gone up, benefitting from the overload of points in Expansion, while Recession continues to go down.
However, in order to answer our question about what happens in the long term, we need to repeat this math over and over again. Eventually it will settle down to stable values, also known as converging. Excel, of course, makes this very simple. We just need to copy and paste our formulas into more columns:
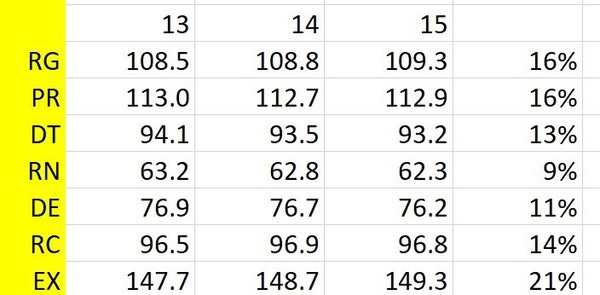
That may be a little hard to see, but it's pretty much settled down in the last few steps. We could go further to get more accurate, but 15 is good enough for our purposes. Here's a zoom into those last columns. I also added a final 'percentage' column:
The final column with the percentages is calculated by dividing each value in the 15 column by the total number of 'points' - 700 in this case, since we started with 100 in each of the 7 states.
And it represents the percentage of time that the game will spend in each state.
So in McMulti the game will be in Recession 9% of the time (the lowest) and Expansion 21% of the time.
Each game will vary of course. But overall, if the game is long enough, this is what you'll get.
Wrapping Up
Is this useful information? I 100% think so. As a designer developing this system I would absolutely want to be able to predict how my states will behave. Once I have the spreadsheet set up it is incredibly easy to tweak the transition matrix and just see how the percentages change.
Yes, if I playtest enough I'll get a feel for it. But intuition isn't always great. Back when you saw the state diagram did you think that you'd be in Expansion that much more than Recession? Probably not. I know that I was surprised.
I hope that the sample spreadsheet gives you a good handle on how this works, and how to set up your own model. This YouTube video is also helpful:
I hope this explanation was understandable and informative! Please let me know with a comment.








Still among the most interesting things I've read related to game design even though it's my second time reading them. Thanks!
I really appreciate you going through these old newsletters as it appears I missed many of them. I obviously need to learn the deeper points of Excel as I never knew of the capabilities it had (thought it only did simpler math). Thanks!